Quickstart for CA PPM
The QIC package is built on the market leading CA PPM SaaS platform. Centralisation of project related data into a central system of record is the most crucial step to PPM success. Centralisation unlocks the fundamental capabilities of a PPM solution.
Project Delivery/Activity Management
Collaboration
Financial Management
Resource Management
Time Management
Business Intelligence
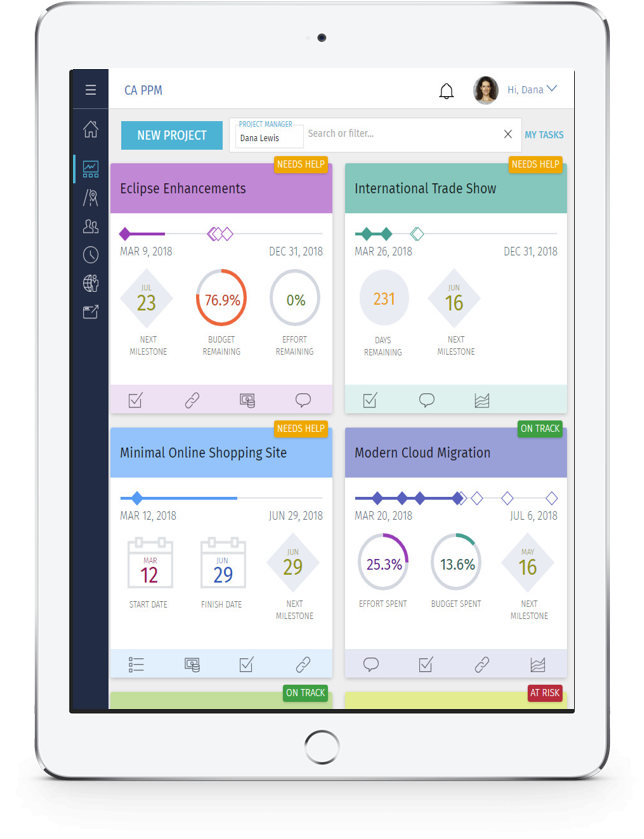
[info_list style=”circle with_bg” font_size_icon=”15″][info_list_item list_icon=”Defaults-check”]Identify all projects throughout the organization and their progress levels[/info_list_item][info_list_item list_icon=”Defaults-check”]Track which projects are experiencing issues and the impact to schedules[/info_list_item][info_list_item list_icon=”Defaults-check”]Provide visibility into project status through reports and dashboards[/info_list_item][info_list_item list_icon=”Defaults-check”]Unlock capabilities outside of simple project inventories.[/info_list_item][/info_list]
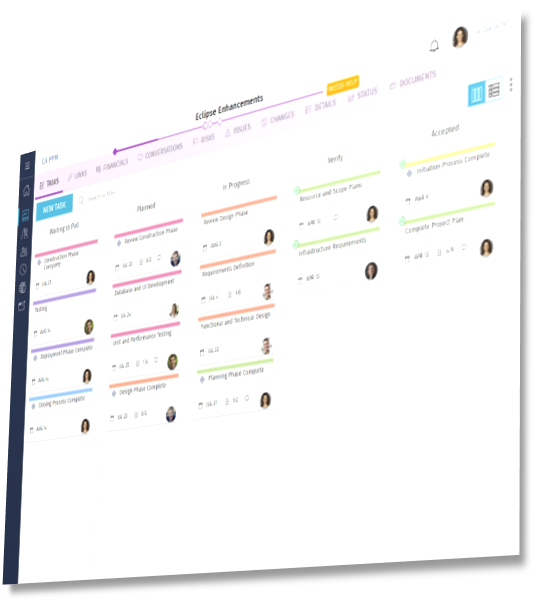
Adaptive Task Management
One overlooked task can set a project back by days or weeks, increasing costs, delaying delivery and negatively impacting parallel projects.
Tasks are important, but managing them—keeping track of which have been assigned, which have been completed, who has accepted them and the status of each can be tedious. Users need clear, easy-to-use task management tools that support team engagement via more modern, social ways of working.
CA PPM includes a task board that draws on popular consumer app-style graphics. A card can be created for each task and used to illustrate status. As status changes, task cards reflect that. Each card includes a to-do list that shows what activities must be completed to accomplish the task.
Team members can discuss the status of the work at the task level through a text box that allows for collaboration within the tool.
Managers with major projects that require the power of a scheduler also have the option to visualize task dependencies and schedules on popular desktop scheduling tools such as Open Workbench, Gantt and Microsoft Project®.
Manage Risks, Issues and Changes
Tighter Team Collaboration

Connect people together
Create a visual task list in minutes on the task board.
For each project, set your own process flow, assign staff to tasks and prioritize work. Keep all team members in synch and share your plans with other groups and executives.
Drill into a specific project, resource or task and ask questions, provide answers or in other ways collaborate. Eliminate emails and meetings by augmenting posts with attachments.
Financial Visibility & Control
Easily manage project financials through cost plans with drill down into transaction details

[info_list font_size_icon=”24″ connector_color=””][info_list_item icon_type=”custom” icon_img=”id^3363|url^https://www.pemari.com/wp-content/uploads/2018/07/Picture1.png|caption^null|alt^null|title^Picture1|description^null”]Auto populate financial forecasts using resource information from the project[/info_list_item][info_list_item icon_type=”custom” icon_img=”id^3364|url^https://www.pemari.com/wp-content/uploads/2018/07/Picture2.png|caption^null|alt^null|title^Picture2|description^null”]Edit, reorder, sort, and group financial information with familiar Excel like functions[/info_list_item][info_list_item icon_type=”custom” icon_img=”id^3365|url^https://www.pemari.com/wp-content/uploads/2018/07/Picture3.png|caption^null|alt^null|title^Picture3|description^null”]Store multiple financial forecasts on a single project for review and approval[/info_list_item][info_list_item icon_type=”custom” icon_img=”id^3366|url^https://www.pemari.com/wp-content/uploads/2018/07/Picture4.png|caption^null|alt^null|title^Picture4|description^null”]Review the detailed transactions behind any actual cost or aggregated cost within a project cost plan[/info_list_item][/info_list]
Optimised Resource Utilisation
Information about how people are being allocated across the enterprise should be at your fingertips.
[info_list position=”right” font_size_icon=”24″ connector_color=””][info_list_item icon_type=”custom” icon_img=”id^3367|url^https://www.pemari.com/wp-content/uploads/2018/07/Picture5.png|caption^null|alt^null|title^Picture5|description^null”]Drill down to see which specific projects each employee is working on as well as each one’s current allocation percentage[/info_list_item][info_list_item icon_type=”custom” icon_img=”id^3368|url^https://www.pemari.com/wp-content/uploads/2018/07/Picture6.png|caption^null|alt^null|title^Picture6|description^null”]Easily switch from a people view to a projects view and back again to clearly understand how they’re intertwined and to evaluate interdependencies[/info_list_item][info_list_item icon_type=”custom” icon_img=”id^3369|url^https://www.pemari.com/wp-content/uploads/2018/07/Picture7.png|caption^null|alt^null|title^Picture7|description^null”]Get alerted to staffing requests requiring approval, and evaluate each request in relation to what other team members are scheduled to work on[/info_list_item][info_list_item icon_type=”custom” icon_img=”id^3362|url^https://www.pemari.com/wp-content/uploads/2018/07/Picture8.png|caption^null|alt^null|title^Picture8|description^null”]Explore adjustments that might better suit the organization with a Microsoft® Excel®–like paradigm that feels comfortable to them on day one.[/info_list_item][/info_list]
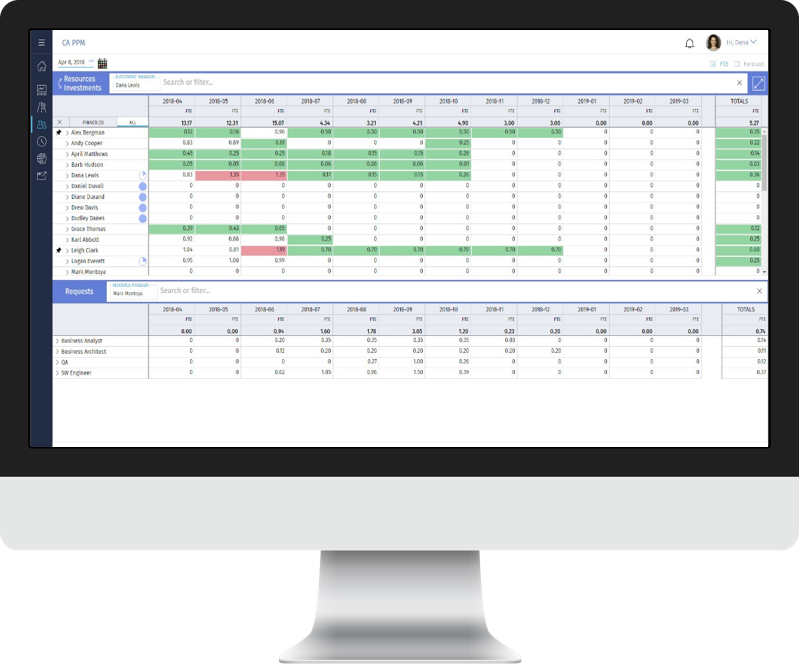
QIC provides a simple way to request and approve resources without having to launch workflows or deal with requisitions. Intuitive, simple and very visual—no complex navigation required.
Light touch, pain free & effective
Time Management
Simple, click free with smart populate and auto-save.
It’s a timesheet… what more can you say.

Deep Analytics
Consume PPM data anywhere on any device
QIC is built on CA PPM SaaS which allows cloud-based customers to connect to major BI systems, including Power BI, Tableau and QlikView.
QIC is also supplied with 60+ out of the box JasperSoft reports and the JasperSoft report designer software.
*Dashboards illustrated are examples using Microsoft BI
